
What's New
Learn about the latest features in Service Insight to continue making labs run smoothly.
Cortex is Service Insight’s operational intelligence layer, embedded directly throughout the platform to provide real-time, context-aware insight wherever you see the Cortex logo. Whether you’re viewing an asset, ticket, maintenance plan, or health report, Cortex automatically understands what you’re looking at and can instantly answer questions, explain anomalies, and recommend next steps.
Cortex automatically loads the asset, device, ticket, or plan you’re viewing into the conversation. Ask about recent alarms, overdue maintenance, utilization trends, ticket history, or performance changes — without manually providing background.
Instantly explore root causes, alarm patterns, recovery behavior, SLA risk, or maintenance gaps. Cortex synthesizes monitoring, maintenance, and ticket data into clear explanations and actionable insights.
Move from question to action. Cortex can guide you to drill into monitoring trends, review historical tickets, assess health scores, or identify recommended interventions — helping teams resolve issues faster and more confidently.
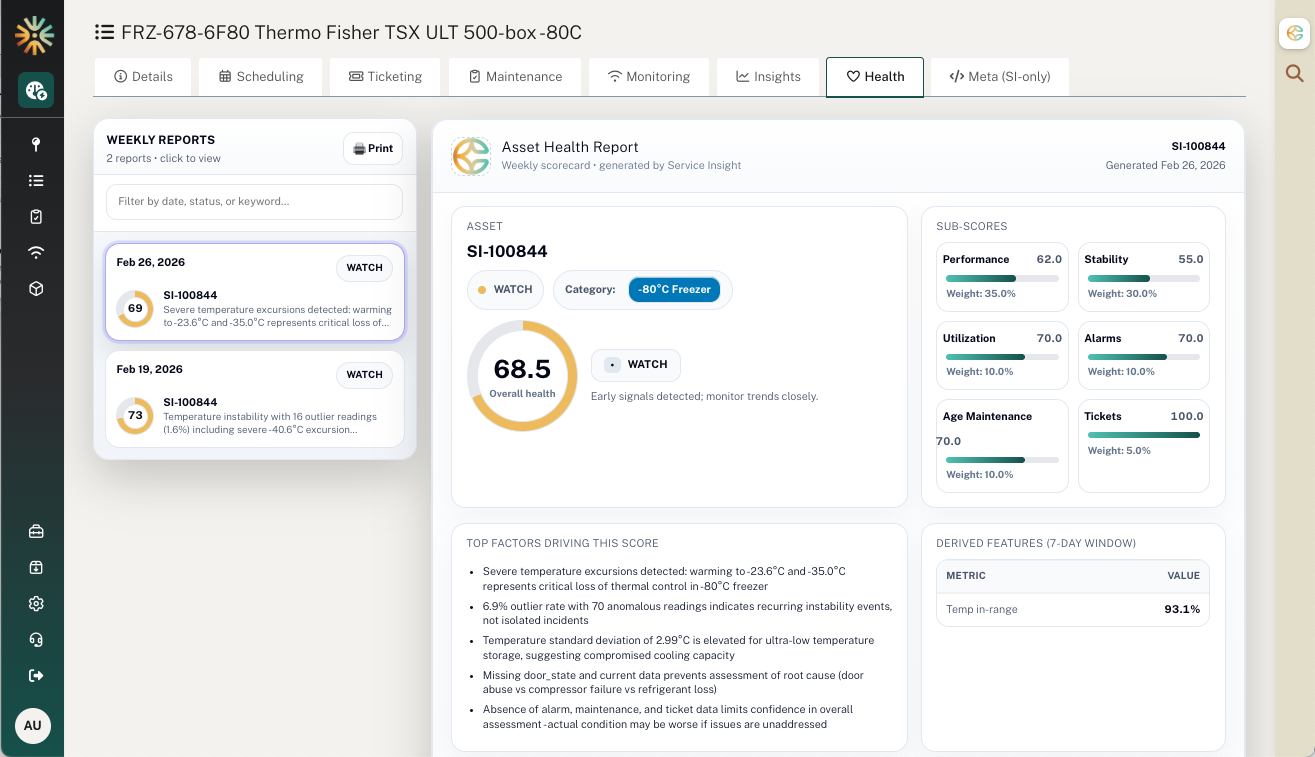
Cortex is your operational intelligence layer inside Service Insight, continuously analyzing monitoring, maintenance, utilization, and alarm data to deliver a unified weekly Asset Health Score for every critical asset. Instead of reacting to isolated alarms, teams can now evaluate overall asset stability, performance trends, and emerging risk patterns before failures occur.
Each asset receives a weighted composite score reflecting performance, operational stability, alarms, maintenance history, and ticket activity — delivering a clear, executive-ready view of risk and reliability.
Cortex highlights the top factors impacting each score, including temperature excursions, instability trends, anomalous readings, and missing contextual data — so teams understand why health is changing.
Assets flagged as Watch indicate emerging degradation patterns before failure occurs, enabling proactive intervention instead of reactive repair.
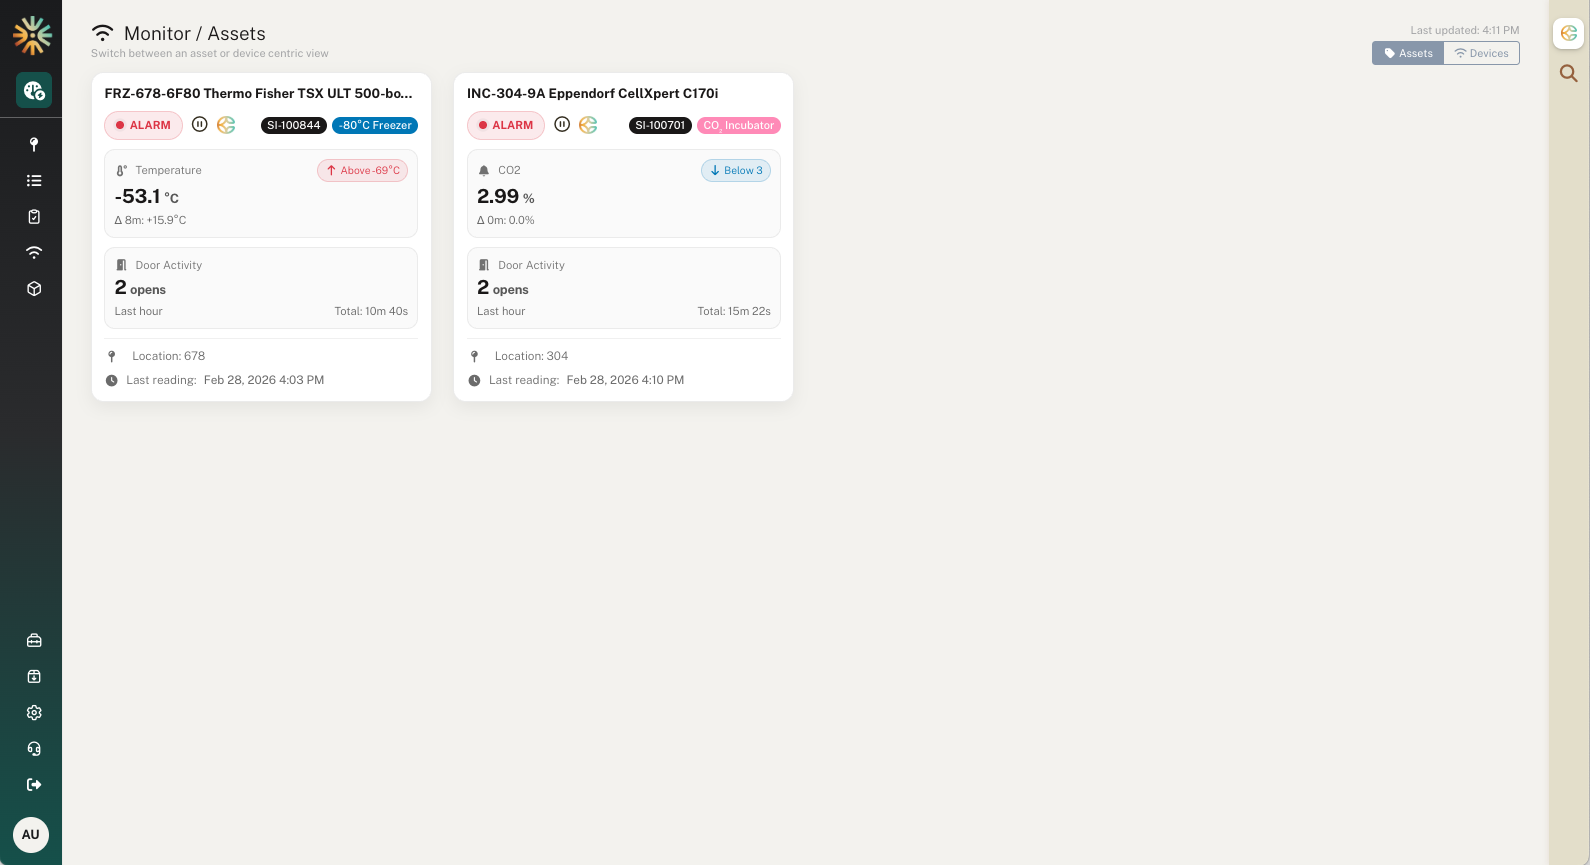
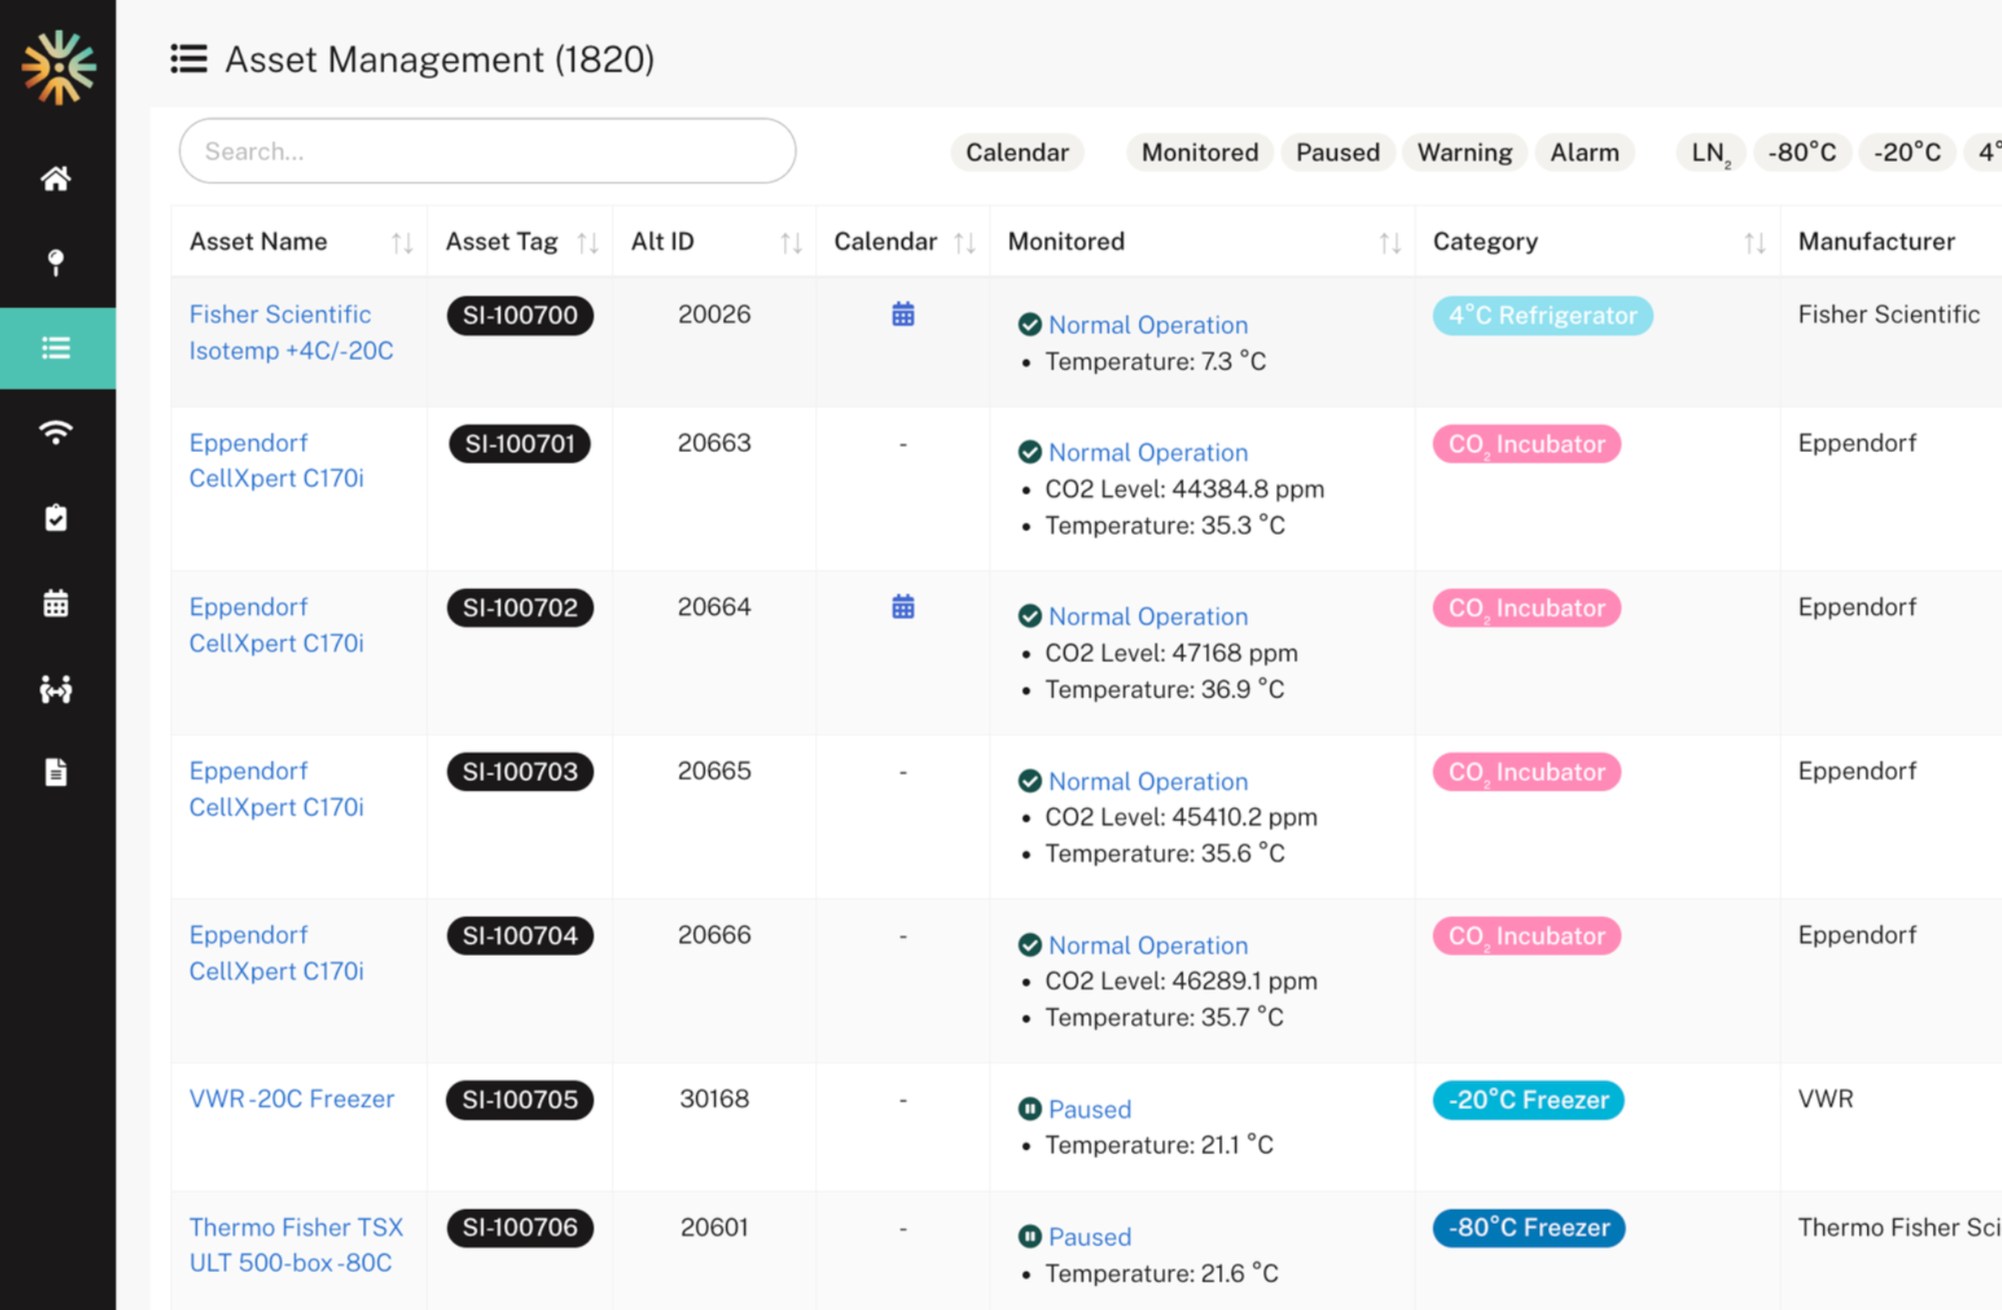
The new Asset-Centric Monitoring Dashboard puts operational context front and center, transforming real-time sensor data into actionable insight. Instead of just showing readings, the dashboard now surfaces critical context like recent door activity, alarm state, and last reading timestamps so teams can understand not just what happened, but why. Designed for fast decision-making in high-stakes lab environments, this view helps you move from alert to resolution in fewer clicks.
See alarm status alongside recent door activity, location, asset type, and sensor deltas. Quickly determine whether a temperature or CO₂ deviation correlates with door openings or operational behavior.
Pause or claim alarms directly from the dashboard to reduce noise and establish clear ownership. No need to navigate to another screen, simply take action the moment you see the issue.
Start a conversation with Cortex directly from the asset view to understand anomalies, recovery performance, or alarm patterns. Ask why something occurred, whether it’s a repeat issue, or what action is recommended next.
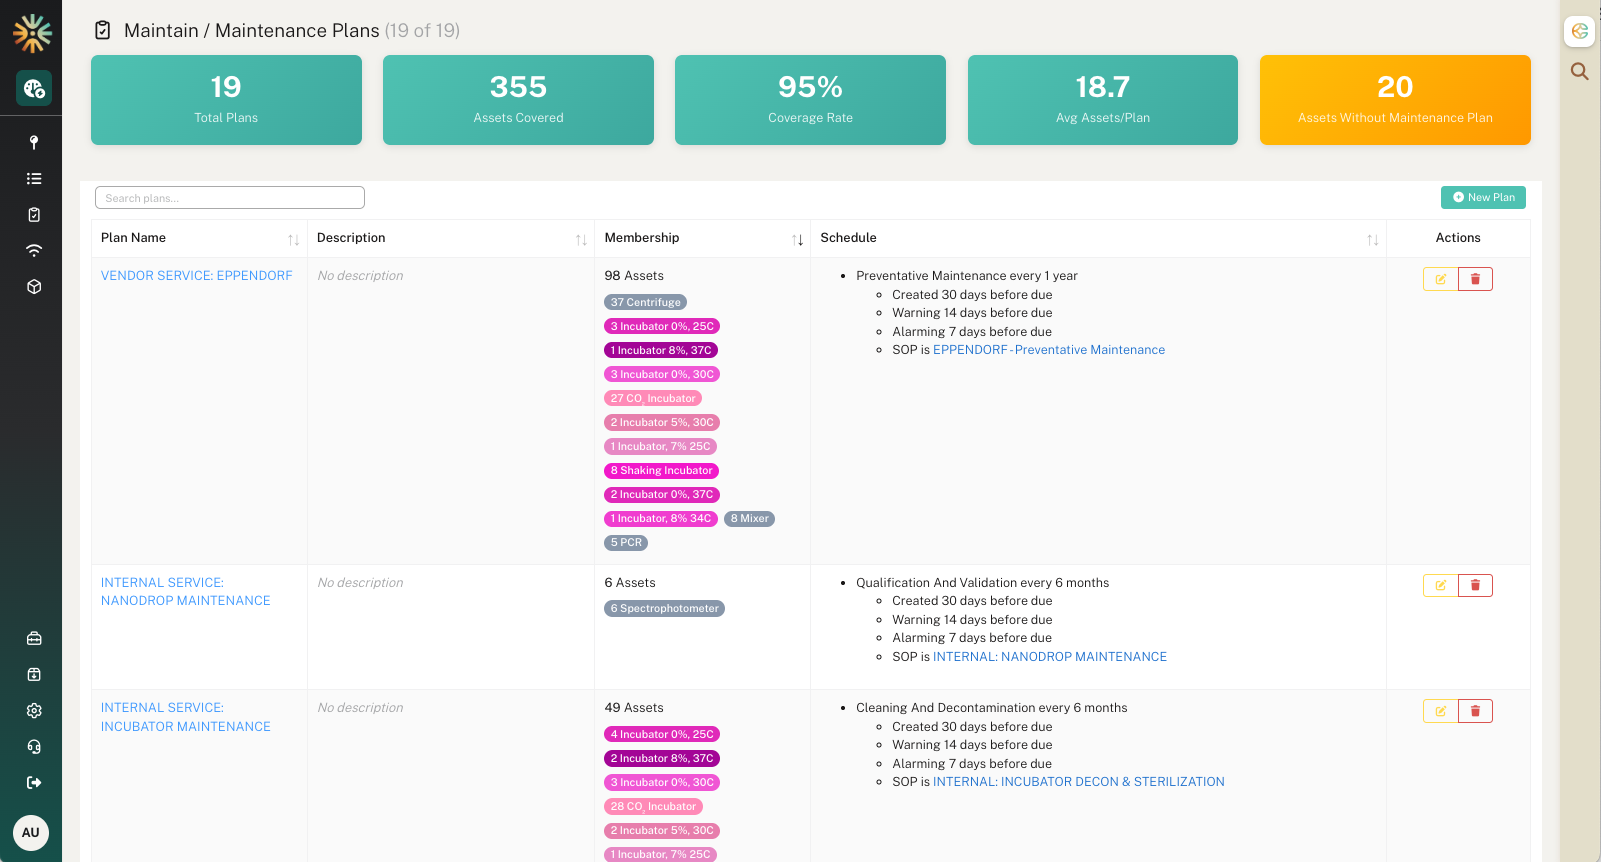
The new Maintenance Plans Dashboard delivers deeper visibility into preventative maintenance coverage across your organization. Designed for LabOps and Facilities leaders, it provides instant insight into plan performance, asset coverage, and compliance gaps all from a single, centralized view. With expanded detail and coverage analytics, teams can quickly understand what’s protected, what’s overdue, and where risk exists enabling smarter planning and fewer surprises.
Instantly see total plans, assets covered, coverage rate, and average assets per plan. Identify assets without a maintenance plan to close gaps before they become compliance or operational risks.
Each plan now surfaces richer context — including asset membership by category, service ownership (internal vs. vendor), recurrence schedules, lead-time rules, alert timing, and linked SOPs. No need to drill into multiple screens to understand how a plan operates.
Quickly pinpoint uncovered assets and assess preventative maintenance distribution across your portfolio. Ensure high-value and regulated equipment are properly protected with recurring service schedules.
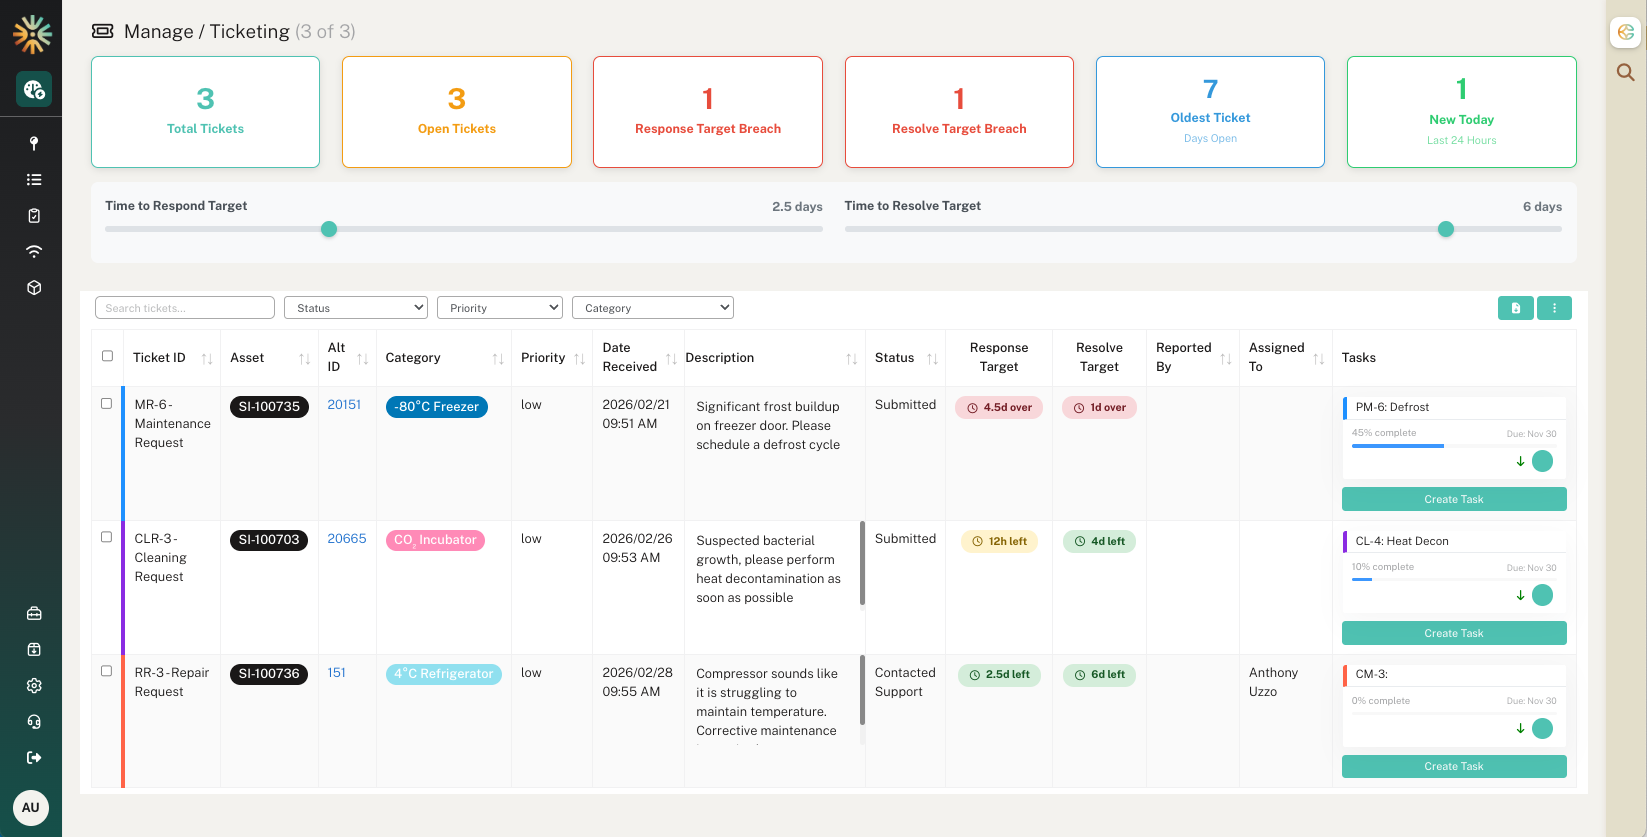
The new Ticketing experience delivers a streamlined, SLA-driven workflow purpose-built for lab operations. Teams can triage, track, and resolve maintenance and service requests in one centralized view. Our dashboard now includes the ability to create linked tasks directly from each ticket to ensure full traceability from issue to resolution. Integrated with assets, categories, priorities, and response/resolve targets, Ticketing provides real-time visibility into performance against KPIs and SLAs while keeping your operations team accountable and aligned.
Create corrective, preventative, or follow-up tasks directly from the ticketing page. Every action is linked to the originating ticket and asset, providing a complete audit trail from reported issue to completed work.
Monitor response and resolution targets in real time with visual breach indicators and aging metrics. Track open tickets, overdue responses, and performance trends to ensure service levels are consistently met.
Centralize ticket status, assignments, priorities, and asset context in a single dashboard. Identify bottlenecks, measure workload, and drive faster issue resolution across your facilities.
01
Asset Tagging and Registry
Robust, end-to-end system for tracking, managing, and recording asset information across the demanding lab environments. Full and detailed visibility and control over assets: information about each asset’s location, condition, and usage history.
Asset Tagging and Registry
Robust, end-to-end system for tracking, managing, and recording asset information across the demanding lab environments. Full and detailed visibility and control over assets: information about each asset’s location, condition, and usage history.
Asset Tagging and Registry
Robust, end-to-end system for tracking, managing, and recording asset information across the demanding lab environments. Full and detailed visibility and control over assets: information about each asset’s location, condition, and usage history.